
Work
Representative projects.
Described generically: clients, products and performance figures stay confidential unless they are already public. What follows is the shape of the work, not a client list.
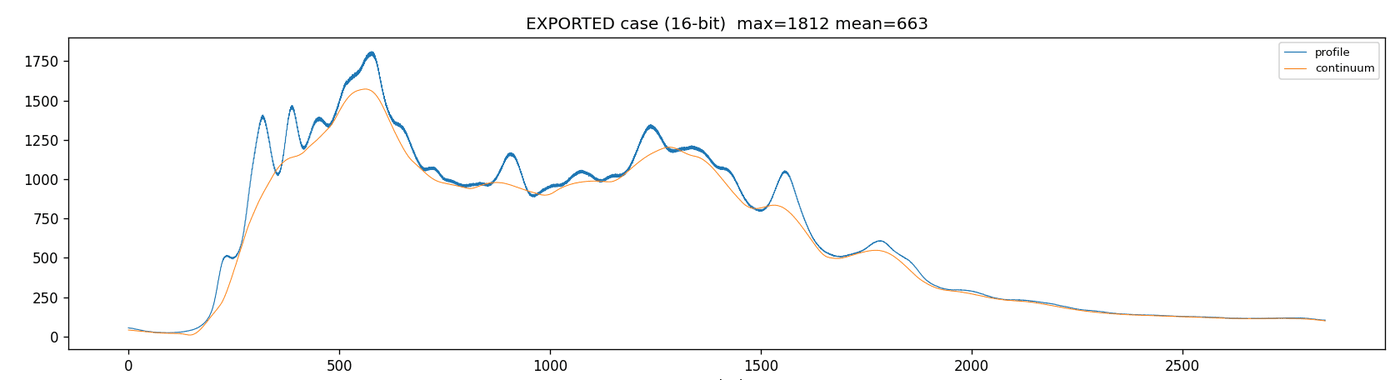
Inline UV–Vis measurement in a scattering liquid
- Context
- A process liquid whose absorbance had to be measured continuously — but which scatters strongly enough that conventional spectrophotometry reports the scattering, not the chemistry.
- What I did
- Optical architecture and radiometric budget, scattering-correction model, spectral processing chain, acquisition firmware, and benchmarking against laboratory reference measurements on undiluted samples.
- Outcome
- A continuous measurement whose agreement with the reference method held up on real, unfiltered process liquid.
Optical particle and droplet sizing instrument
- Context
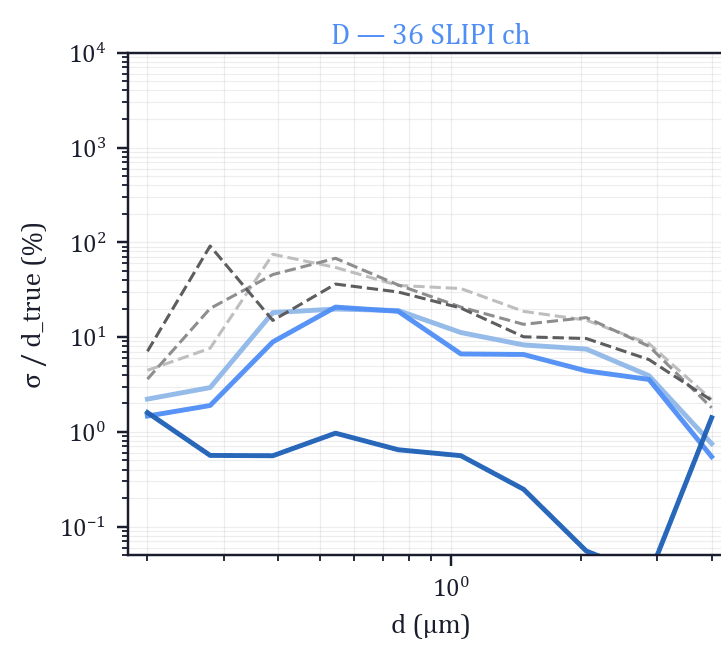
- Size distributions in suspensions and emulsions, where the established reference instrument requires dilution — and dilution changes the very distribution being measured.
- What I did
- Forward optical model of the measurement, inversion strategy for the size distribution, a machine-learning inference path for on-device use, and a validation campaign against an established laboratory sizer.
- Outcome
- Distribution estimates that correlated with the reference instrument, from an instrument that measures the sample as it is.
Handheld measurement instrument, end to end
- Context
- A field instrument that had to be usable by a process operator with no training, and survive being carried around an industrial site.
- What I did
- Optical head, microcontroller firmware, on-device processing, touchscreen operator interface, calibration workflow, data export, and the production test bench that verifies each unit.
- Outcome
- A self-contained instrument a non-specialist can run correctly on the first try.
Instrument-to-process integration layer
- Context
- Measurements that were only useful once they reached the control system — across sites with different buses, different PLCs and different expectations about data.
- What I did
- A protocol and integration layer covering industrial fieldbus and network protocols, mapping instrument data into control and historian systems, plus commissioning in the field.
- Outcome
- Measurements available to operators and control loops inside the systems they already use.
Monte-Carlo model for design decisions
- Context
- A design trade-off — geometry, wavelength, detector — that would have cost months to settle by building hardware.
- What I did
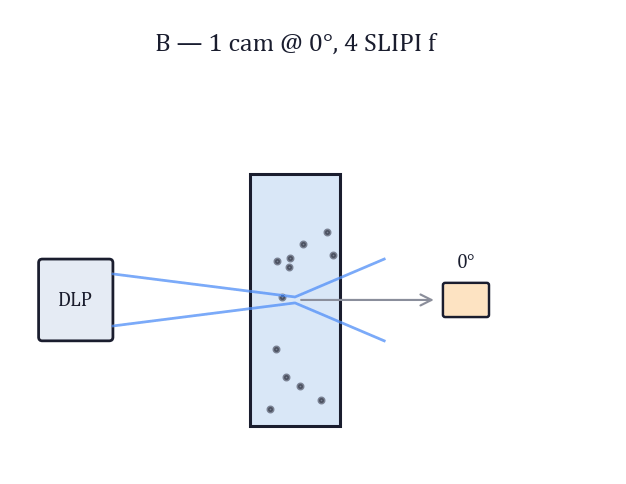
- A Monte-Carlo radiative transfer model of the measurement in scattering and absorbing media, used to explore the design space and set expected measurement limits before committing to hardware.
- Outcome
- Design choices made on simulated evidence, and a model that kept paying off as the design evolved.
Measurement models running on the instrument
- Context
- Inference that worked fine in a notebook on a workstation, and needed to run inside an instrument with a fraction of the memory and no network connection.
- What I did
- Model architecture and training pipeline, dataset strategy and augmentation from real acquisitions, quantisation and embedding into the instrument software, plus drift monitoring against reference values.
- Outcome
- Inference running in the instrument, within its timing and memory budget, with a documented failure mode rather than a silent one.

Your project is probably not on this list.
It rarely is. Describe it and you will get a plain answer on whether it is a fit.
Start a conversation